Someone recently asked me how to monitor the CPU and memory utilization, as well as the peak bandwidth of CISCO Catalyst switches, as I collect those metrics for mine using collectd with the SNMP plugin.
Please note that any data definitions in i.e. your types.db need to be synchronized to all
other machines that receive the data if you are pushing the data onto a central server.
Total Bandwidth
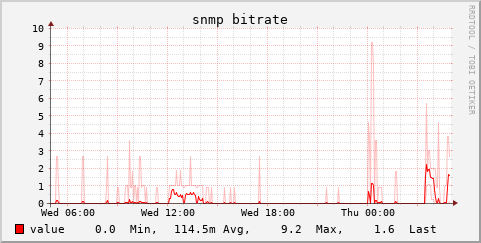
This requires the CISCO-C2900-MIB and the following configuration for the SNMP plugin in collectd.conf:
<Data "cisco_2900_peak">
  Type "bitrate"
  Values "CISCO-C2900-MIB::c2900BandwidthUsageCurrent.0"
</Data>
Load Averages
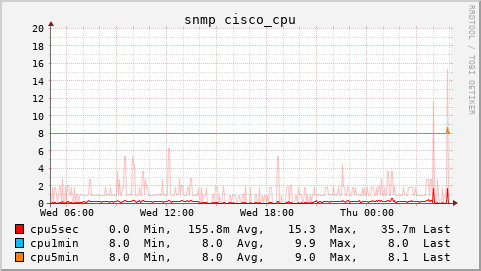
This requires the CISCO-PROCESS-MID, following configuration for the SNMP plugin in collectd.conf:
<Data "cisco_cpu_avg">
  Type "cisco_cpu"
  Table true
  Values "CISCO-PROCESS-MIB::cpmCPUTotal5secRev" "CISCO-PROCESS-MIB::cpmCPUTotal1minRev" "CISCO-PROCESS-MIB::cpmCPUTotal5minRev"
</Data>
And the following data definition in your types.db or types.custom.db:
cisco_cpu cpu5sec:GAUGE:0:100, cpu1min:GAUGE:0:100, cpu5min:GAUGE:0:100
Memory Usage
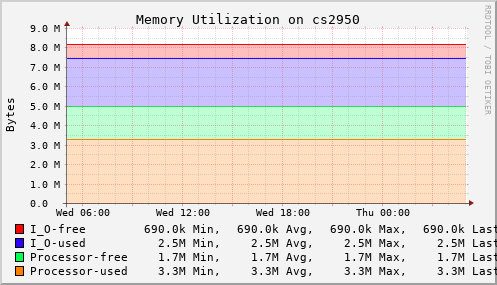
This requires the CISCO-MEMORY-POOL-MIB, following configuration for the SNMP plugin in collectd.conf:
<Data "cisco_memory_pool">
  Type "cisco_memory_pool"
  Table true
  Instance "CISCO-MEMORY-POOL-MIB::ciscoMemoryPoolName"
  Values "CISCO-MEMORY-POOL-MIB::ciscoMemoryPoolUsed" "CISCO-MEMORY-POOL-MIB::ciscoMemoryPoolFree"
</Data>
And the following data definition in your types.db or types.custom.db:
cisco_memory_pool free:GAUGE:0:281474976710656, used:GAUGE:0:281474976710656